
The “back to school” buzz is in the air, and just as it was key to organize your papers in middle school using your trusty Trapper Keeper, it’s important to manage your ads using your AdSense data. Doing so lets you to see the effectiveness of the different implementations you’ve tested out this month and make decisions about next steps. So let’s flash back to the good old days and apply what we learned in middle school.
Vocabulary: Understanding your data
Before you could use a new word from your vocabulary textbook, you needed to understand its definition. Similarly, there are several important statistical values on your Advanced Reports page for which you should know the definitions before doing any analysis. I recommend that you check out our glossary for each of the terms (Page Impression, eCPM, Clicks) to understand how these values are affected by the changes you make to your site.
Foreign languages: Translating your data
Learning a foreign language involves taking a great deal of new information and breaking it down into sizeable chunks to interpret it. As we mentioned in a previous post, URL and custom channels are a great way to take a more granular look at your site and track specific implementation changes you’ve made.
It’s also necessary to create an appropriate measurement for your data. Too much is confusing, and too little is not going to give you accurate results. Normally, good measurements include 30-, 60- and 90-day increments.
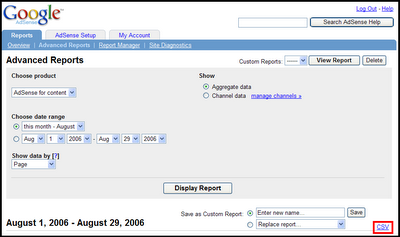
Finally, you’ll need to analyze the data. A great feature we offer is the CSV link, which enables you to download your data onto your hard drive so you can rearrange it to your specific needs. I recommend using Google Spreadsheets or Excel.
Art appreciation: Displaying your data
As your art teacher used to say, a picture is worth a thousand words. Staring at raw data can be tedious and won't help you visualize trends in your AdSense stats. This is why tables and graphs are so effective. A table can make your data more comprehensive and easier to read, while a graph helps you to observe visually what's happening to your various values. If you notice that one channel is performing better than another over a set period, it may be time to implement the same changes into your other pages.
Tip: Track the various implementation changes you’ve made on a separate sheet, and note the date. You can then review those dates later and compare them with previous sets of data to discover which changes had the greatest impact on your site.
Quarterly report card
I recommend that you perform this type of analysis every 3 months to ensure that you are optimizing your site to its potential. By tracking and managing your data, you will be on your way to becoming a more savvy AdSense user. And of course, don’t forget to thank your 7th grade teacher for imparting this knowledge.
Vocabulary: Understanding your data
Before you could use a new word from your vocabulary textbook, you needed to understand its definition. Similarly, there are several important statistical values on your Advanced Reports page for which you should know the definitions before doing any analysis. I recommend that you check out our glossary for each of the terms (Page Impression, eCPM, Clicks) to understand how these values are affected by the changes you make to your site.
Foreign languages: Translating your data
Learning a foreign language involves taking a great deal of new information and breaking it down into sizeable chunks to interpret it. As we mentioned in a previous post, URL and custom channels are a great way to take a more granular look at your site and track specific implementation changes you’ve made.
It’s also necessary to create an appropriate measurement for your data. Too much is confusing, and too little is not going to give you accurate results. Normally, good measurements include 30-, 60- and 90-day increments.
Finally, you’ll need to analyze the data. A great feature we offer is the CSV link, which enables you to download your data onto your hard drive so you can rearrange it to your specific needs. I recommend using Google Spreadsheets or Excel.

Art appreciation: Displaying your data
As your art teacher used to say, a picture is worth a thousand words. Staring at raw data can be tedious and won't help you visualize trends in your AdSense stats. This is why tables and graphs are so effective. A table can make your data more comprehensive and easier to read, while a graph helps you to observe visually what's happening to your various values. If you notice that one channel is performing better than another over a set period, it may be time to implement the same changes into your other pages.
Tip: Track the various implementation changes you’ve made on a separate sheet, and note the date. You can then review those dates later and compare them with previous sets of data to discover which changes had the greatest impact on your site.
Quarterly report card
I recommend that you perform this type of analysis every 3 months to ensure that you are optimizing your site to its potential. By tracking and managing your data, you will be on your way to becoming a more savvy AdSense user. And of course, don’t forget to thank your 7th grade teacher for imparting this knowledge.
For more articles about different markets please visit my articles and links directory.
http://googlelinksdirectory.com/
Thanks for yours time have a good day :-)

No comments:
Post a Comment